ARCH / GARCH models for Time Series
Time Series Forecasting - Part IV

I am a Data Scientist. I write about Machine Learning, Data Science and Python.
Volatility is a statistical measure of the dispersion of data or variance around its mean over a certain period of time.
In finance, it refers to how much the price changes between periods. For example, if it is high, the price may increase or decrease a lot from one day to another. High volatility is very risky, it can be beneficial if you want to make big profits fast, but it can also make you lose a lot of money in a short period of time.
Generally in finance, there are periods of high volatility followed by periods of low volatility, and vice versa. For example, during an economic crisis the volatility increases, and when the situation improves the volatility drops. This is called volatility clustering.
ARCH models
High volatility makes forecasting harder. ARCH models can be helpful in predicting periods of high volatility.
ARCH stands for "Auto-Regressive Conditional Heteroskedasticity":
Heteroskedasticity: it refers to volatility or variance of the time series data
Conditional: it means that the volatility is not fixed over time, it varies with time.
Auto-Regressive: the volatility at a certain time point will depend on previous timesteps
We use ARCH models for the variance, whereas we were using ARIMA for the mean.
The ARCH model represents the error term (εₜ) as a product of:
Standardised White Noise (random and unpredictable): ωₜ
Standard Deviation of a number "q" of previous periods: σₜ
$$\varepsilon_t = \omega_t \sigma_t$$
ARCH models the variance of the time series as a regression of the values of a number "q" of previous squared errors:
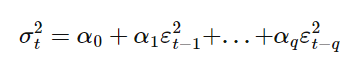
Despite ARCH being called "Auto-Regressive", resembles more a Moving Average equation.
Issues with ARCH
ARCH models are very useful, however, they have three main issues:
They are not good at modelling persistent volatility. For example, there may be periods that have more volatility than others, in which the volatility persists or stays high or low for some time. This is also called volatility clustering. They are often described as "bursty", meaning that there may appear some jumps in the prediction.
They are over-parameterised models, they require many parameters to make a good forecast.
They assume that positive and negative volatility distributions have the same impact on the response variable. To deal with these issues, ARCH models can be extended or generalised.
GARCH models
GARCH models are a type of time series model that is commonly used in finance to model the volatility of asset returns.
GARCH stands for "Generalised Autoregressive Conditional Heteroskedasticity". It is a generalisation of the ARCH model that tries to address some of their issues.
It extends the capabilities of ARCH models by including additional variables and terms in the model. While ARCH models only consider previous observations, GARCH also takes into account previous variance or volatility values. This adds the terms that resemble more to an Auto-Regressive model.
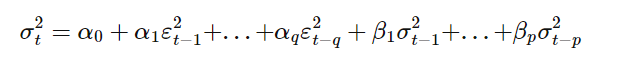
GARCH models the variance of the time series as a regression of the values of a number "q" of previous squared errors and a number "p" of previous variance values.
Improvements of GARCH
We've seen that ARCH models have certain issues. Thanks to GARCH models these are sorted:
They are much better at capturing volatility clustering.
They are parsimonious. Which means that they are able to achieve similar or better results with few parameters.
They don't assume that positive and negative volatility distributions have the same impact on the response variable, they are capable of modelling asymmetry effects.
However, GARCH models still exhibit some issues. For example, they are not able to capture leverage effects, which refers to the fact that negative values have a greater influence on future volatilities than positive values.
There are some extensions of GARCH that are able to deal with these two effects, for example, AGARCH or EGARCH models.
Estimation of parameters Similarly to what we saw in ARIMA models, the parameters "q" and "p" of the GARCH models can be estimated by plotting the ACF and PACF graphs of the squared observations.
You can improve your ARIMA model!
Check this article or my Twitter thread on this!
I will soon share some code about how to do this in Python. So if you liked this content don’t forget to follow me here and on Twitter not to miss out!